Website Software. Includes http Logs Viewer, and Nihuo log file analyzer.
© Rae West. August 14th 2021, November 20 2022. v 4 March 2023
This is intended for people with their own sites, or who are thinking about starting a website or helping a friend. Just a look at software, including supplements to AWStats, for people who'd like more data about visitors to their sites.
Note: I've assumed log files are complete. It must be possible for log files to be searched, and some entries to be deleted, to remove evidence of their appearance. It's the sort of thing Jews do!
Note: Email logs have quite a complicated set of structures. I've never seen software to handle these, and I suspect they could be intercepted and processed or deleted.
Nihuo is old by web standards, and has remained unchanged since about 2010. It's Chinese, and is sometimes sold under other names, such as 'AlterWind' and 'WebLog Expert'. It has more features, or 'functionality', than any other such software known to me. A few months ago, I damaged my copy, infuriatingly. But recently I managed to get it to work again. I find it useful, when it worked, and decided to put hints online. I made a mistake with the name, which wouldn't load for at least a month; nobody emailed me about it.
I've put these notes for people who want to go beyond AWStats and tackle this inscrutable one-payment software. I recommend it, and haven't found anything similar, but of course many people may not find it worth the extra learning effort. If you read some of this, you should see whether you want the additional—but tiresome—information which can be extracted. Free trials could help you decide whether to pay.
My website is informational only, constructed only with HTML. Yours may not be. I don't use WordPress or Drupal or other 'management systems', since they change too often for my liking. So these notes may not apply to you, if e.g. you have a lot of ads or WordPress or .php files—but you may try it! I accept no responsibility for others' mistakes or errors.
This information is not subsidised in any way by Nihuo (or anyone else). I'm trying to help people frustrated by it and tempt them into another try.
[0] Can emails be saved for future reference?
[1] What are .gz log files?
[1a] Note on CoffeeCup the USA HTML program I have used for years to design big-lies.org, my website.
[1b] Note on statshow.com and some other supposed webstats sites.
[1c] Note on Piriform 'CCleaner' (CrapCleaner)
[1d] Note on Wordpress
[2] AWStats. French, Staple statistics supplier for websites. But it's on your host's website. Not easily downloaded or programmed.
[3] http Logs Viewer. Maltese. Full details on every log file; varied information extracted fairly quickly. Less useful for large amounts of data, because it doesn't condense information together.
[4] Nihuo. Chinese. Long-established and detailed log analyzer for .gz files. I'm concentrating on this software. It may help people with their website(s). For all I know, it may contain persistent bugs.
4.1 Getting the Data In
4.2 Setting the Questions
4.3 Getting the Information Out; pictures, graphs, visuals!
 4.4 Counting Facebook (and other referrers) which load from your site
[0] Can emails be saved?
If you have your own website, you may have your own email address—I used comment@big-lies.org for years.
The file manager software records have (of course) the public_html contents of the site. And there's a mail subdirectory/folder, with four subfolders at least, one for the web address, and others, cur, new, and tmp. The first has a comment subdirectory, which itself has five others, .Archive, .Drafts, .Sent, .Spam, and .Trash.
These may be recognisable—protonmail has the very same folders. I haven't analysed these in any detail, but there are software packages which can search for email titles, names of senders, contents of the email, and, presumably, details which are usually invisible, such as the paths taken by the data between nodes.
If the contents are all saved on a home disk system, presumably you have an archive, retrievable if you can find software to handle it. In my experience this sort of software is written up in not-very-readable techie-speak.
In my case, many emails were deleted without my permission, perhaps to save space. Hence this warning. But there are other types of email, such as hotmail and gmail which I've used for years. However, I don't know any way to recover these systematically, though of course it's easy to find all the ones under some name, and laboriously download them one by one.
If someone out there has a good suggestion, let me know; I'll put it here if you like.
[1] .gz log files
This format must date back to the early days of Internet.
Typically: log into your host's website; you'll need your password, which may be already in place. Go to CPanel, and then to Raw Access, probably in METRICS. There'll be a list of 'archived raw logs'. You'll have to find one—probably the most recent date.
I
MPORTANT note on 'Raw Access': you should see near the top a stark comment: 'Configure Logs'. Below is an important pair of checkboxes:—
Archive log files to your home directory after the system processes statistics. The system currently processes logs every 24 hours.
Remove the previous month's archived logs from your home directory at the end of each month.
The first box should be checked, the second box not checked. This will mean that each day your results will build up, until the month is complete. And the month's figures will not be removed. Unless you don't mind losing your records.

This window (below; taken from a file of mine, dated Jul-2020 (but including dates outside that range!) shows the sort of thing you get if you unzip .gz files. Generally, this is automated for you, so you won't be aware of it. Note the I.P. address, the date and time information, the command (typically GET), the hardware source of the command, and the software source—or something like that. And other things: for example, '200' means the command worked properly; the file size is shown (sometimes these figures may be compressed, or slow if there was a small error).
On your website host, clicking on 'logs', typically gives one month's records as a zipped file. Or you may click on 'File Manager', then 'logs'.
It's safest to download your log files; otherwise they may be deleted or lost. You'll need to click on 'Download' and move the file into a folder, called something like 'ACCESS MY LOG FILES'. I'm afraid this is easier to demonstrate than to describe. But with a bit of luck you'll end with a set of .gz files, all with month information. (These sort alphabetically, not by month!)
.gz log files are of the form shown in the window, below, which I unzipped into its expanded form: each line is (something like) website address-month-year - action taken - information on who asked for the information - what happened. '200' (read as 2 0 0) means everything worked; 404 (read as 4 0 4) means it wasn't found. Each item is called a 'hit': this can cause confusion, as a page may have HTML text plus a dozen more hits of graphics. The word 'page' applies to a complete page with pictures. For example, my 'Home Page' is big-lies.org/index.html with its large number of graphics, including its background picture and animated gifs.

[1a] Just a note on CoffeeCup, a program to write HTML. Includes of course folders, filenames, links and graphics, and allows the results to be uploaded and downloaded
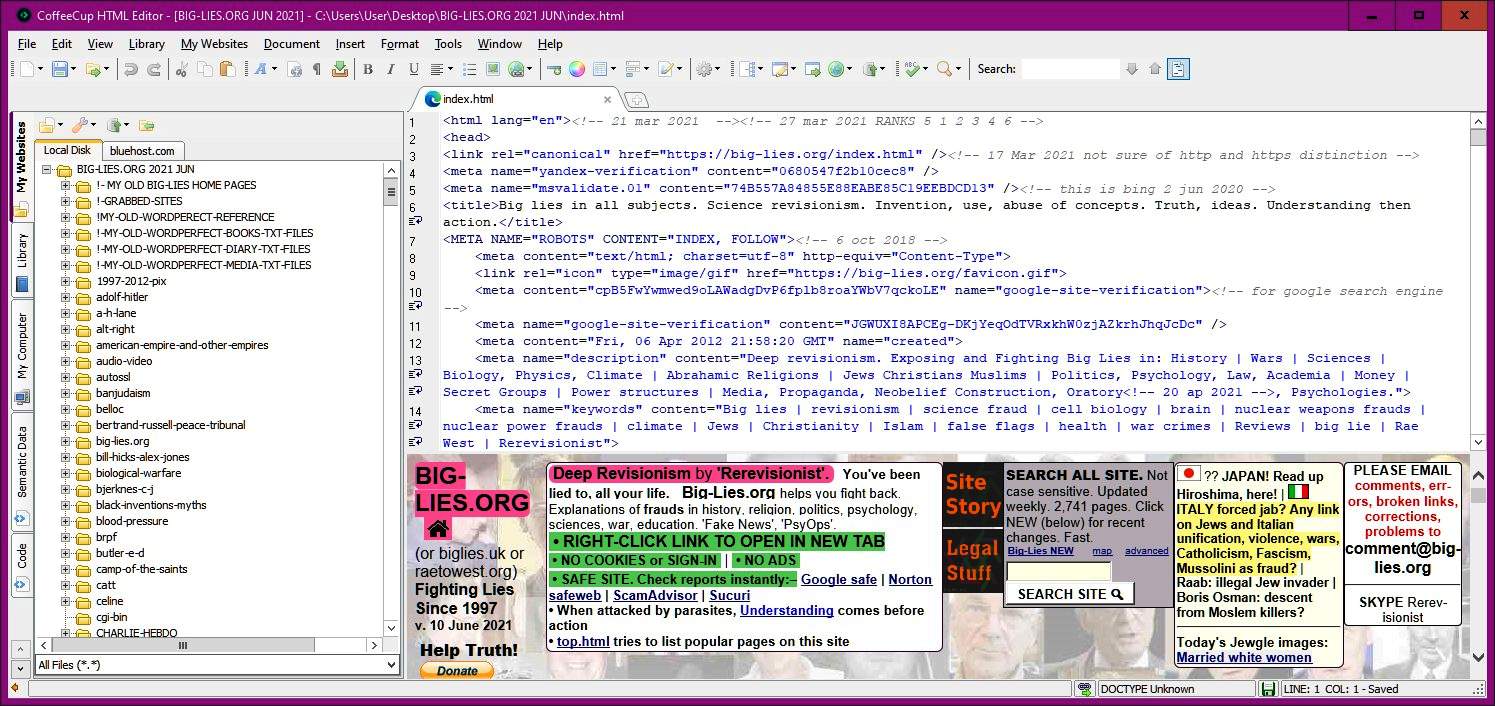
I've used this program, CoffeeCup, for years. Once you've worked out your host address, and IP, and your password, and a few other things, this software will log itself into your website. The screenshot (below) shows the display you get after loading one of your files from disk, then pressing the F12 key. It interprets the HTML code according to any browser you have loaded; for example, Chrome). This is a valuable feature!
CoffeeCup has a search feature, which looks inside each file. This is something these other software items don't usually do. That's the reason I mention it here, despite its being somewhat out of place.

[1b] Note on statshow.com and some other very similar supposed webstats sites.
This seems to be a site designed as part of net censorship, under-rating some sites. (One of these is Big-lies.org, and I've noticed this for years.) They give no information on their data collection techniques. It's possible they may simply make up figures. No big deal; just remember it's easy to tell lies online, and people accustomed to lies presumably love it. This sort of thing is the reason I prefer to use log analyzers, and hope the logs are accurate.
[1c] Note on CCleaner.com (CrapCleaner; with other features in additional to cleaning hard disks).
Just a warning that this site isn't particularly 'intelligent'. It has options to select what it is you want to clear, but this is only much use to people who know their problems already. Realistically it dates from the times when people had smaller memory in their computers, and scrambled to find smallish items to remove. It has other features, for example an indication of what parts of storage are large, but I remember Norton programs decades ago which were better. So be careful. 'Recuva' (to recover things deleted in error) may be useful.
[1d] Note on WordPress.
WordPress is a very useful tool, interposed between a host and the final appearance of a site. It dominates sites; it's useful for handling videos and generally arranging text. I don't use it myself because I've noted quite a few sites which were kicked off, apparently unilaterally, by WordPress; no surprise as Jewish control dominates. And WordPress has many third-party plug-ins and add-ons; when they work they are terrific, but if they are badly-designed or updated or incompatible they may stop working, or give strange displays. For sites with teams of workers this may not matter; but sites with few workers may not want to deal with problems. Personally, I don't in any case find it easy to use occasionally. If you use it, try to arrange full back-ups, if you can. Otherwise you may be lumbered with trying to reconstruct years of work.
[2] AWStats
As far as I know, most website hosts have this software built in. And have since about 2000, when Laurent Destailleur wrote it in Perl. It is positioned online; I don't recommend you change it, since it may harm your host and cause your site to be disliked! It is not programmable; Destailleur must have selected the items he thought most useful. The usual setting is accumulating hits by the month. This means for example if you look for 404 errors, to check for mistakes in your own site, this works well at the start of a month, but at the end of a month there may be large numbers of errors to check.
(I should mention Google Analytics. I'm pretty certain that every page of your site has to include their bit of software. For a large site, this is tiresome to instal. Google aren't very clear on this point, which is a black mark against them).

| |
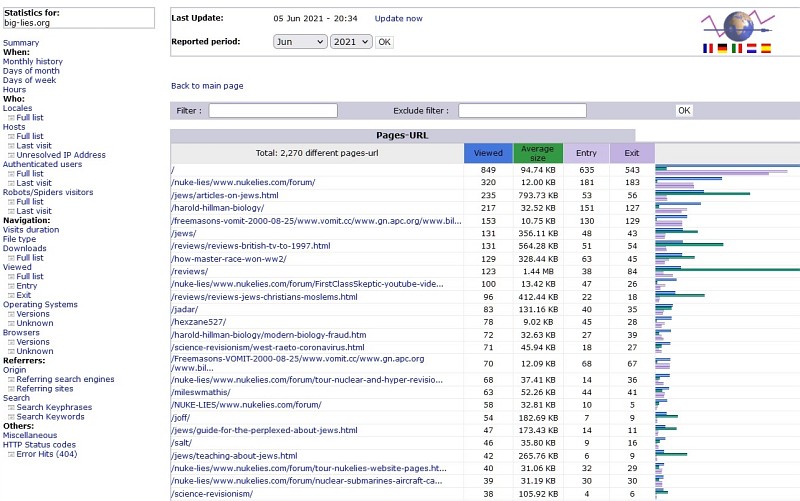
Left: AWStats (note its globe-with-flags logo) report of pages (this means the whole page, both HTML words and all their graphics images). The reporting period is June 2021, but the date was 5th June at last update. There are 4 days' results here, sorted in descending order of number of views. For example, my piece on the 'master race winning WW2' had 129 views. The 'average file size' is often smaller than the actual file, if the data was compressed. There's a fair amount of scope for doubts over the results.
The names appear in directory (=folder) order. There can be confusions with capital letters: my nuke material originally was in a folder NUKE-LIES, but it seemed best to change this to nuke-lies; so the same file can have different names. Don't blame me!
I'd guess this is probably the most common use for AWStats. Second most common I'd guess would be assessing the amount of activity.
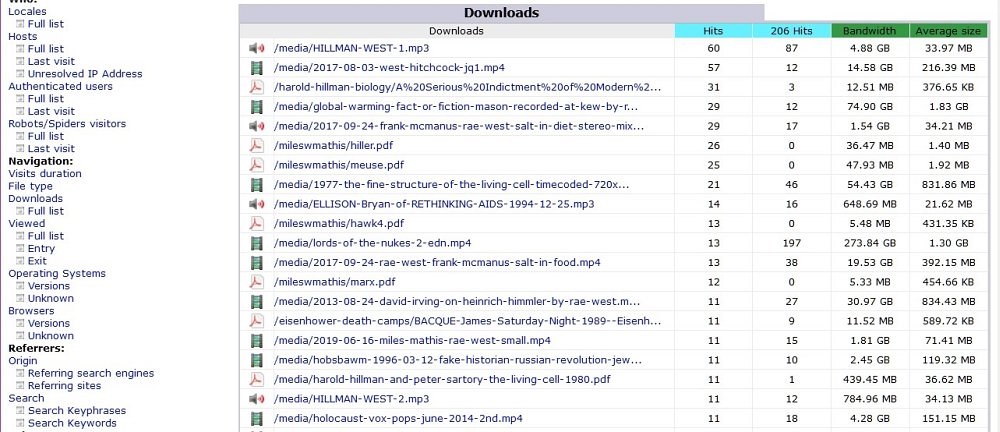
Below: AWStats reports on 'downloads', meaning files which aren't HTML pages, i.e. not hypertext pages with their graphics. As you can see from the report below, these include .pdf text files in portable document format, video files, and audio files. All these are often very large files. Other files, such as spreadsheets, word documents, and plain text files can show up.
AWStats reports the total number of still graphic files (.jpg, .gif. .png, and others) but as far as I know does not show individual image downloads, so if you're looking out for an image, AWStats won't tell you if anyone looked at it.

|
|
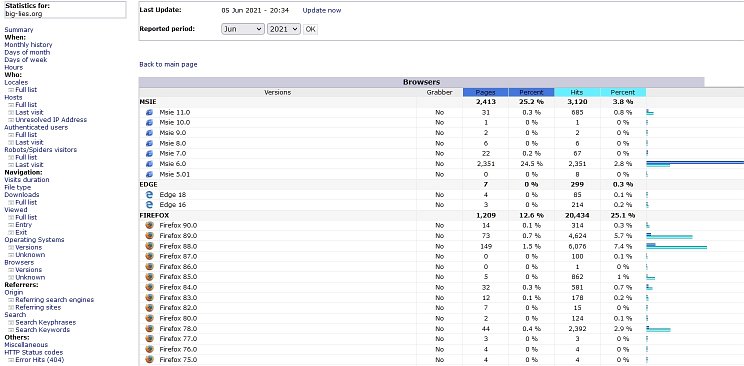
Below: One of the many uses of AWStats. Here, it shows the browsers used by the customers, though this report is only a small part of the total—Chrome in particular has very many builds. The column headed 'Grabber' lists site grabbers as if they are browsers, if they were used—these download big parts of the site. They're also called 'offline browsers'. Peaks of activity are often the result of site grabbers. A relatively new grabber is 'Cyotek'; an older one is HTTrack. To find them, you have to list all the browsers by clicking on 'versions'. But note that if an unidentified browser was used, Grabber may be shown as ? and if you want to track down a mysterious peak, you might try http logs viewer.
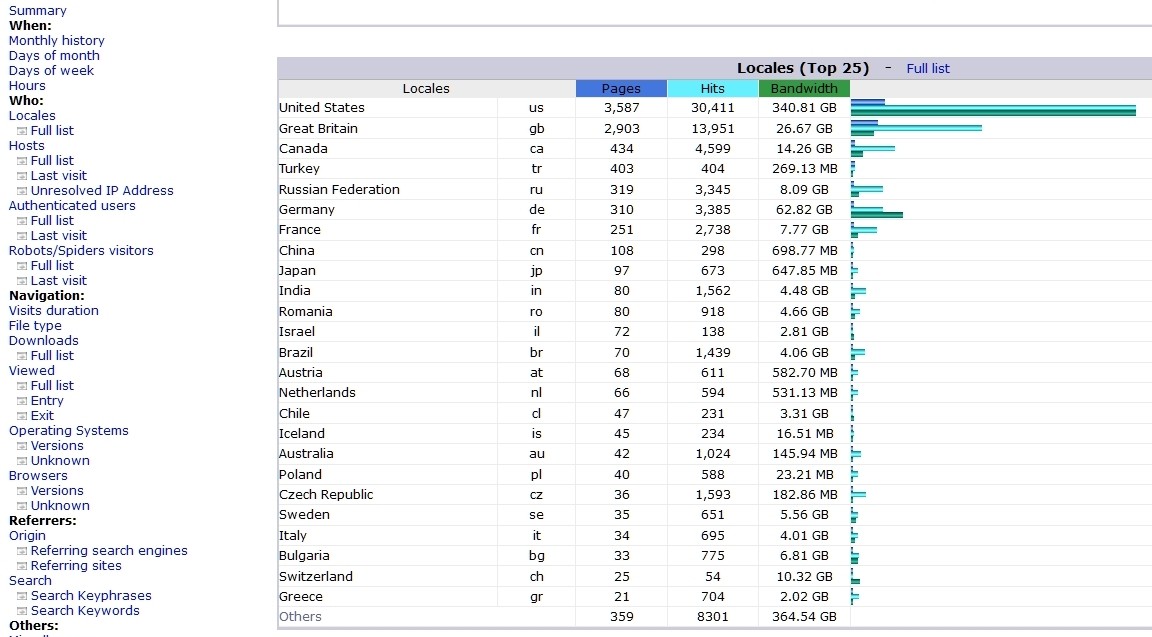
Right: 'Locales' lists customers' countries in descending order of pages. These are inferred from the I.P. addresses (and some are doubtful; they may be hidden, or in small countries acting for nearby countries). My server at one time listed national flags, but these probably were too time-consuming to be looked up for each hit. My site's nuclear scepticism meant that Japan had been rigged into very few views; I was interested to see it here, turning out to be 'Hiroshima University of Economics'. I quite like the feeling of getting hits from a vast range of countries.

| |
 |
[3] http logs viewer
Was called Apache Logs Viewer, and supplied from Malta; now it is renamed http logs viewer, and may have been sold. Free download; I forget what features weren't included, probably number of lines. At one time this software was supplied from Malta. This no longer seems to be the case.
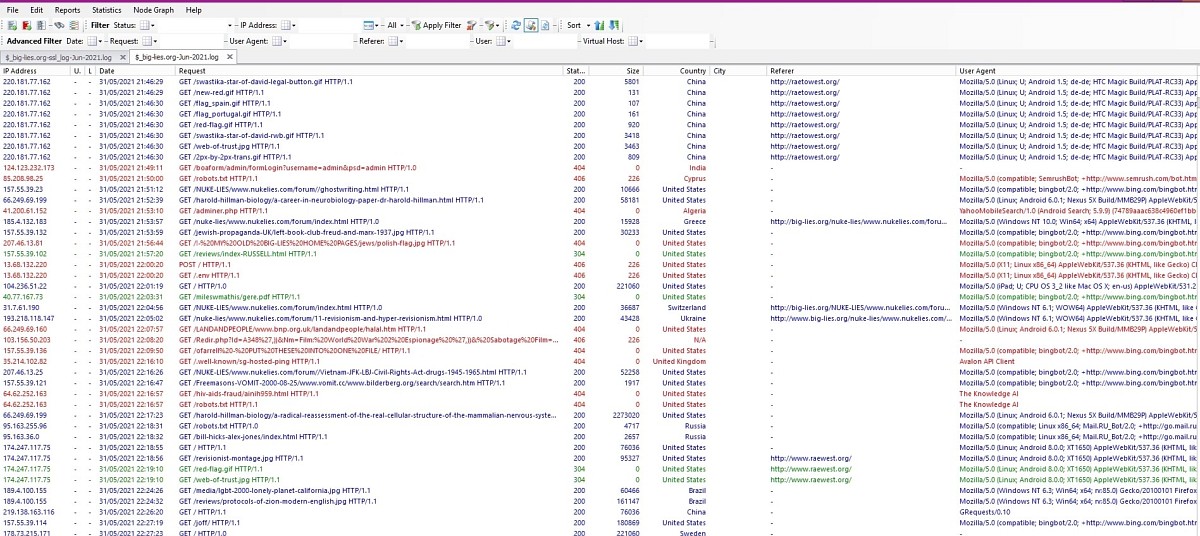
Below I've included a full screenshot since the connection with .gz logs is clearer, and readers are less likely to have seen this in action. The sequence in which each line is unpacked seems identical to the sequence in the original log file. This must be why they appear in date order, earlier to later.
The software takes the .gz file and unpacks every item, starting with the IP, the date and time, and colour-coding where the author thought it would be helpful. The bar at the top allows filtering by status code, IPs, file names, referrers and so on; and each column can be sorted, so that I.P.s, dates, file names, file sizes, referrers (=sources of enquiries), can be shuffled. Sorting the referrers can allow you to distinguish between hits from spiders, facebook, other websites.
All this takes some time to get used to. In this example, two .gz files (one http, one https) are loaded. Without altering the .gz files, a whole year would mean loading 24 files, if there are both http and https files. Generally this software is better for small-scale investigations, such as locating errors, or looking at a new spike, or checking hits by country, or looking at very large files, or finding what's wrong with spiders. (In this case, Bing doesn't seem to work).
A typical enquiry (at least for me) was looking to see why a review of Patrick Moore's autobiography had a sudden spike in view. I found these were mostly from 92.204.174.134 — apparently in Filderstadt, in Germany.
Generally, to arrange the data, use the dropdowns plus windows to select one or more features, then click on 'Apply filter'. A simple example is: type 'reviews' into the 'Request' box, clicking on its dropdown and pick 'Include'. Then include the Status 200. And click on the green 'Apply filter'. You'll get a list of all the files with 'reviews' in their name, which loaded correctly. Click the 'Apply filter' with the red X to clear these settings. With a bit of practice it'll seem just another typical bit of software.

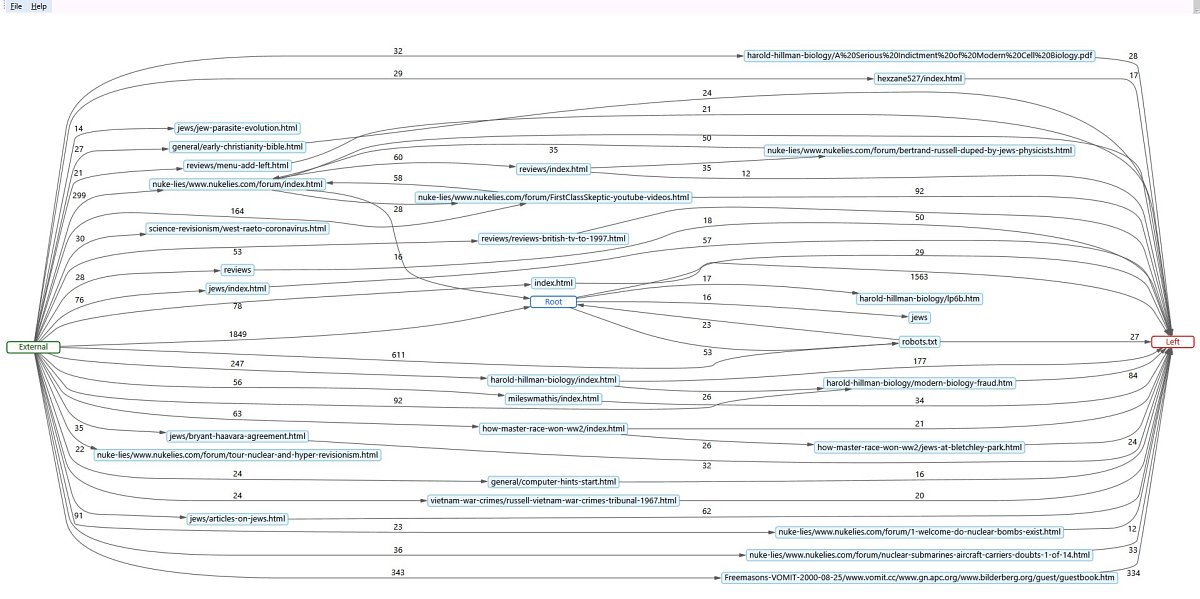
Below: A 'node graph' can be drawn by this software very rapidly, something I haven't seen elsewhere. It has only two parameters, which are not well explained, so you'll have to experiment. I don't think I was ever quite sure what 'Root' meant. But as you can see the results are quite impressive, though I'm not sure I ever found a convincing use for them. Perhaps such a graph might suggest useful internal links in a website. Needs a large screen!

[4] Nihuo log analyzer
Nihuo is similar to AWStats (it would have to be, since it works on the same sets of raw data). But there is more of it, including colourful graphs (though an absurd light yellow colour may predominate). Some information just isn't there: it can't tell who's sitting at a keyboard. It can't distinguish unique visitors, since a computer may have many people using it. It can't tell if an IP is shared, by students at a lecture who share the same broadband.
I can't recommend this unreservedly—something which applies to most software, of course. I'm trying to show some of the intriguing results you may find. It's your decision as to whether you want to investigate further.
Getting the Data In
This is the icon for Nihuo software. Useful to have on your desktop.
| |
When Nihuo Web Log Analyzer is new, you'll get the 7 images at the top, from 'New' to 'Help', but not the Filenames, which state what 'Analyze' will do. 'New' refers to the set of monthly log files which the software looks at when it runs. In my case, I have only one website. If you have several, each can have its own setting. Here, my first is set for 2021 alone; it is now mid-June, 5 and a bit months. The second adds up all my logfiles, going back to 2012, for a long-term survey.
Once these are set up, each 'Name' is edited; I try to make the settings meaningful. The first analyses one day only, the last one in its list of access files. Spiders are ignored (not that they aren't important; but here I'm concerned with hits by genuine users). Such things as names with .php or wp- are ignored; anyone typing these is wasting their and my time.
There's a 'copy' feature (right-click on one of the light blue processes, then edit the new file) so new variants can be generated.
|
Setting the Questions
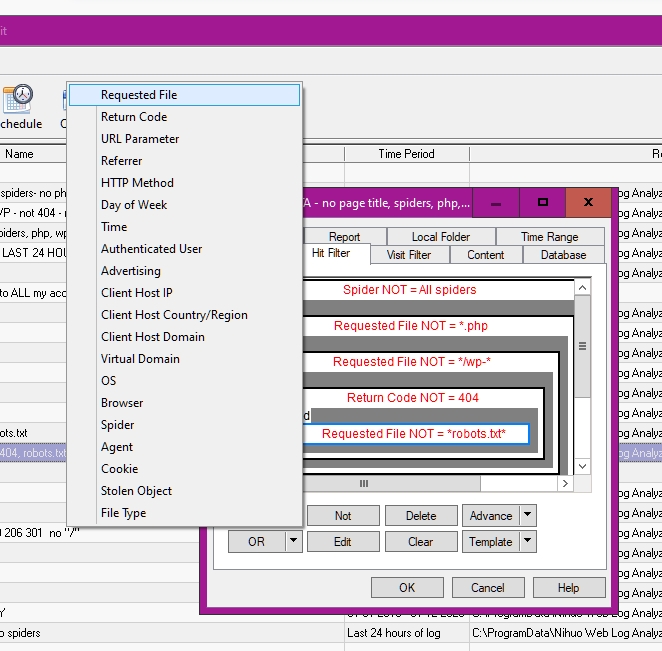
Options list for 'Requested File'. This is the File's name, but the Return code (200, for example), Referrer (maybe facebook), Browser (if you want to see Sahara users, for example). Already selected are some examples. I know it's a bit of a pain.
A complication in the nested ANDs allows ORs to show up confusingly. But I'll leave that with you.
| |
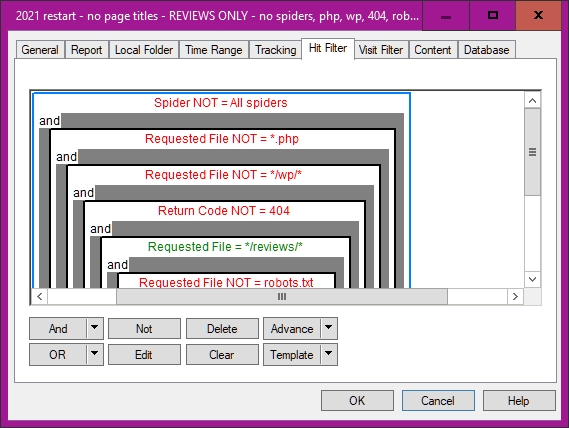
'Hit filter' selects which data to display. I don't want spiders; this means selecting spiders, then clicking NOT—probably Reverse Polish Notation. Then it rejects .php files and WordPress files (which should be NOT = */wp-* in fact) and robots.txt. And the requested file has to be in the /reviews/ folder, in which I put most of my reviews.
|
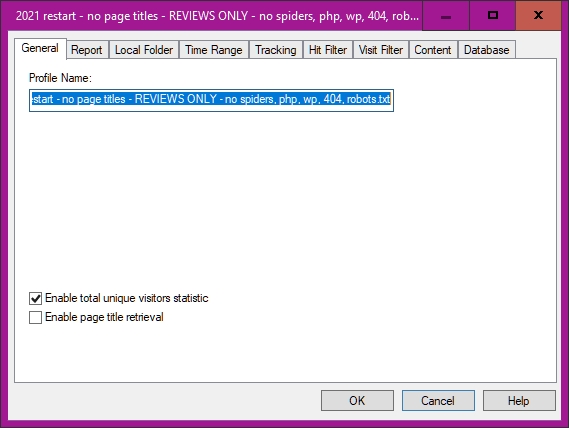
Setting up (or changing) a report. Note at the bottom that 'page title retrieval' can be enabled; i.e. nihuo looks at the file and notes what's between <title> and </title>
| |
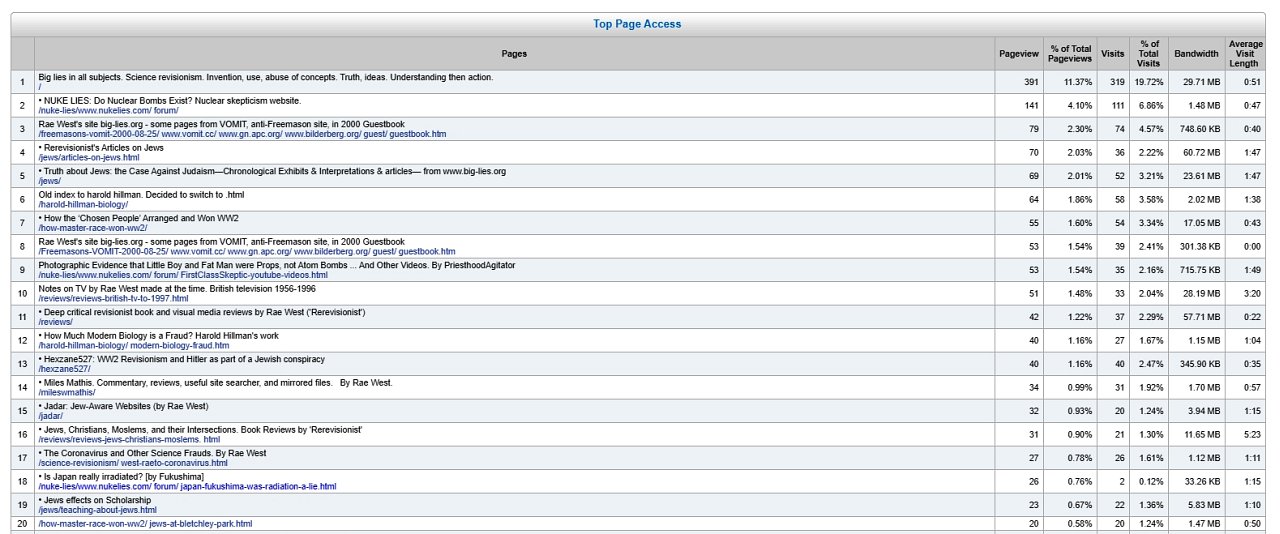
Shows a report of the page views in descending order—BUT including <title> information taken from the pages. This takes time; but can be helpful to highlight weak or wrong titles. But they have to be switched on when the report is set up (or changed)—see the previous frame.
|
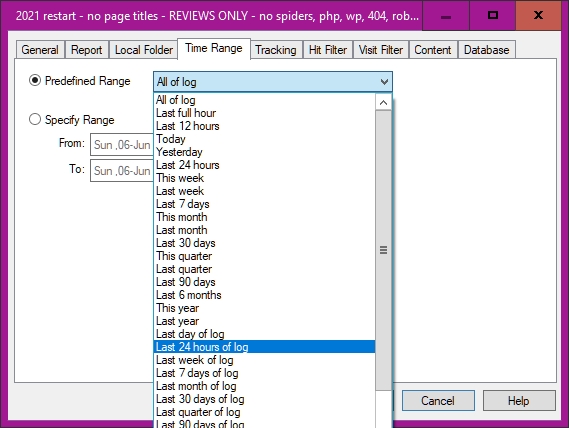
Here, the time range tab selects from a range of options. 'Yesterday' may mean a full 24 hour period, or the hits from midnight to the next midnight, or perhaps other things—hence the surprising range on offer. Or selection can be made from a calendar. You may find the hour: minute: second setting tricky. 
| |
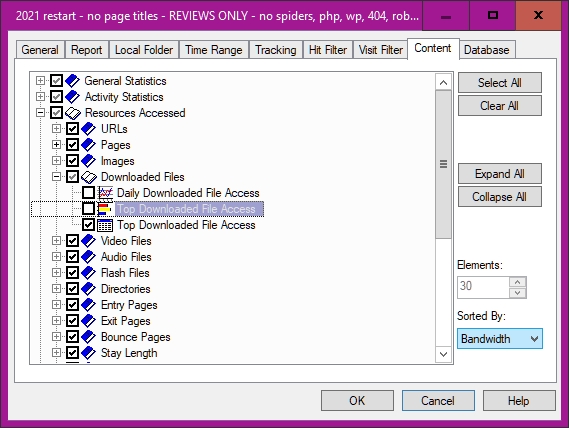
The 'Content' pane allows you to change the display, if you can work out how to do it. For example, data can be sorted by file size in descending order, putting big files first.
If you find all this confusing, you may join the club. 
|
Getting the Information Out
This is when you click on 'Analyze'. (Or 'analyze all'; I haven't found any difference.)
Typical message (one of many) as Nihuo works its way through the data, to the final report. The long, complicated reports will take longer, but in my experience it is unusual for the total time to be excessive. 
|
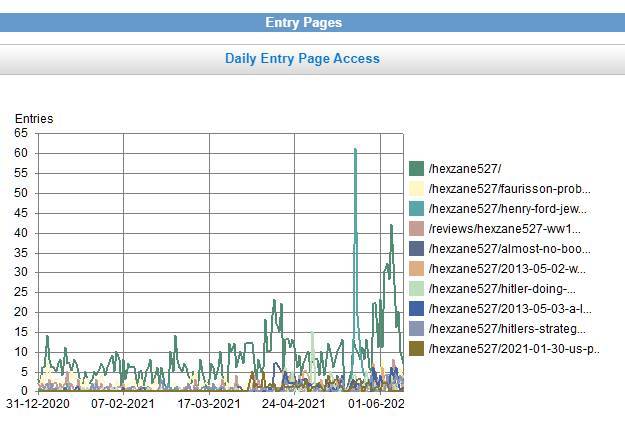
Nice (but perhaps not too useful) graph, for 2021, plotting daily totals for my hexzane527 pages, listed by filename in descending order. I found no way to change the second, pale yellow, colour for something more readable. 
|
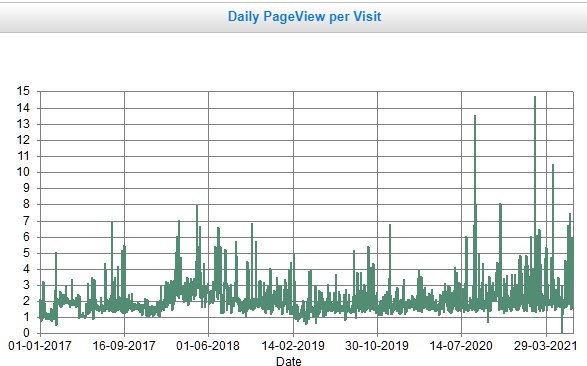
Daily graph. Shows Page Views per visit. That means the average number of pages downloaded by visitors. Least possible is of course 1; the graph gives some idea of how many pages are looked at by visitors. From the start of 2017 to the end of March. 2021.
| |
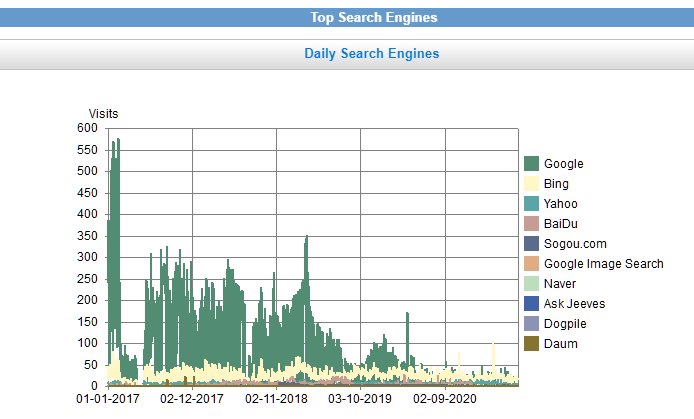
Shows effects of search engines. Note the huge drop in hits from google as censorship bit. Luckily I get hits from many sources.
|
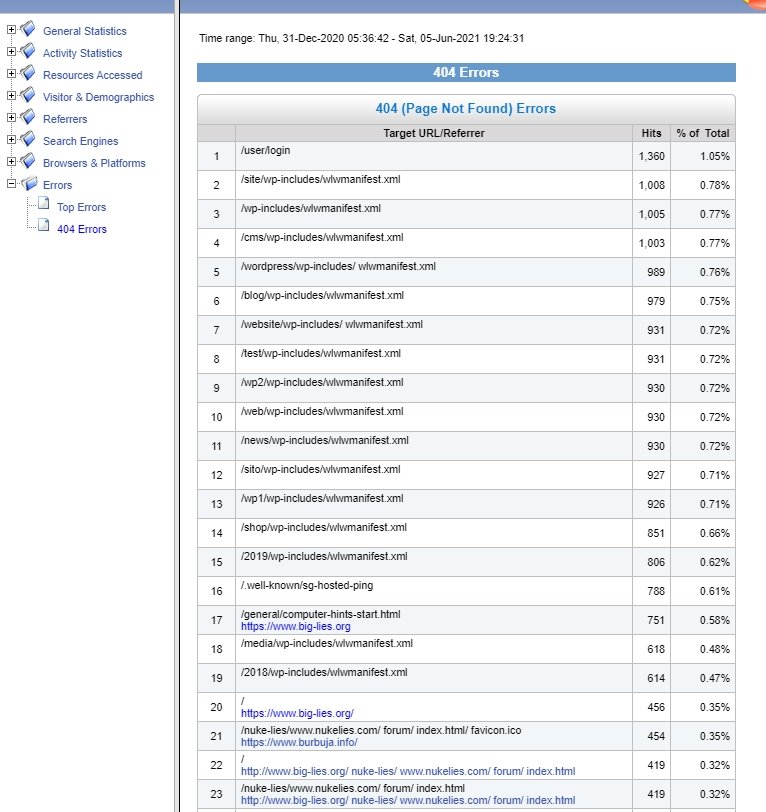
All 2021, but choosing only 404 errors, 'File not found'. This displays all the requests that weren't to be found on your site. Could be anything from silly requests to typos in your files or failure to upload. Can be useful in seeing the errors your viewers type in. And for detecting typos in your links; I once found a 'revew' instead of 'review'. 
| |
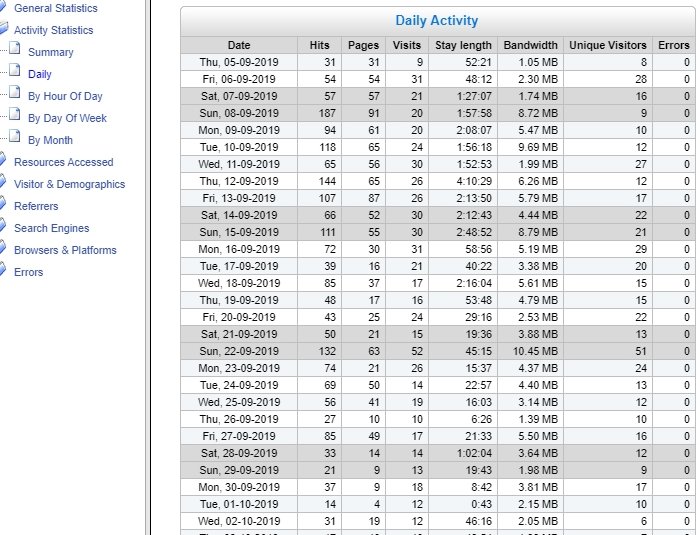
This table shows daily listings for all filenames with 'hexzane' in them. Note the dates listed down to the precise date.
It also shows the first entry was on 5th Sept 2019, which can be a helpful reminder. 
|
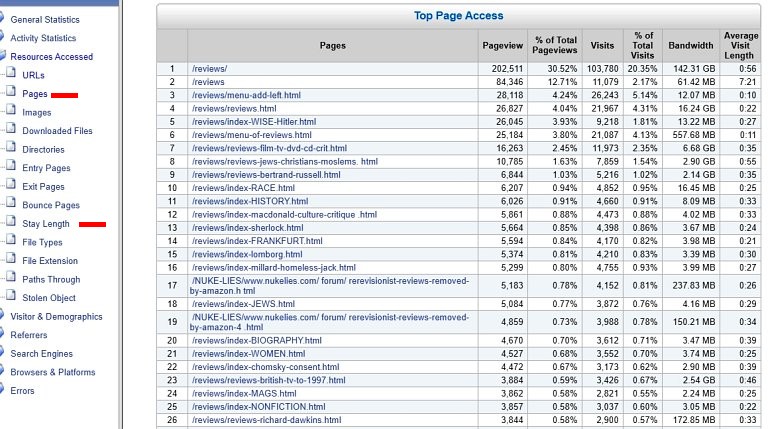
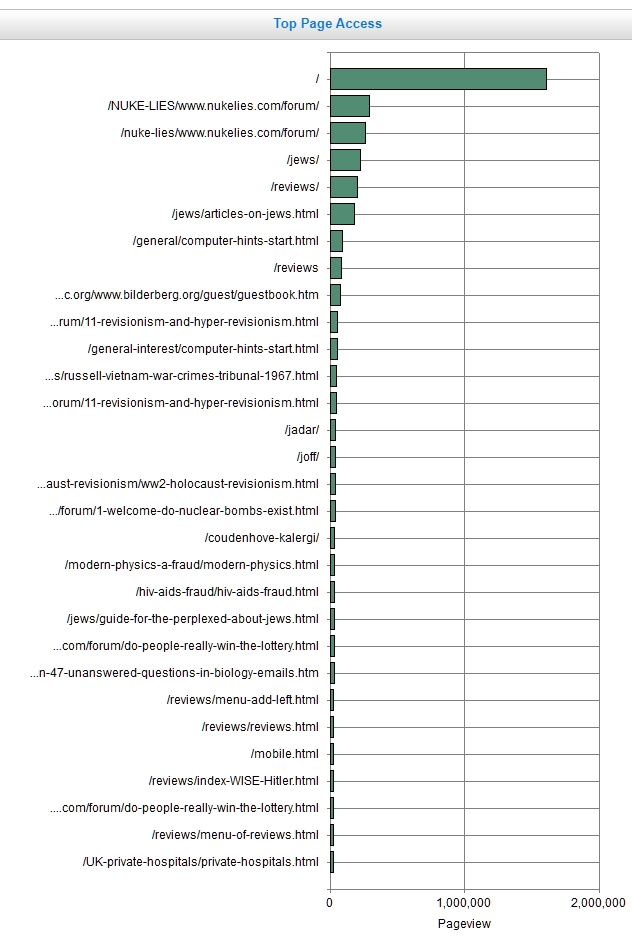
This analysis lists, for roughly ten years, all my reviews, in descending order of pageviews.
Page views of my very long reviews home page, then my book reviews, but some films, TV etc. If the numbers are high, all this may cheer you up. 
Stay Length adds the lengths of time for which pages were viewed, given an indication of how long was spent online looking at the pages. I'm unsure how these figures were found; people may for example just leave pages open, or may download and save quickly.
The example (below, for an ordinary day) shows how unexpected results can appear; as examples, I'd thought hexzane527 wasn't very popular, and had no idea that Wheless's Is It God's Word? might have thoughtful readers.

| |
Bar chart of top filenames, over ten years or so. Bar charts are an easy way to indicate the relative numbers of pages downloaded. The figures are given, additionally, in a separate table. 
|
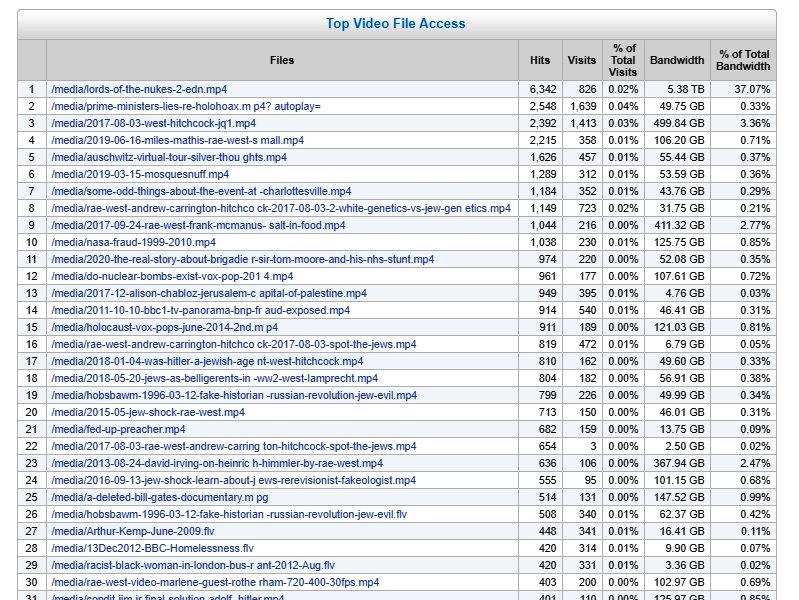
Lists about ten years of videos downloaded from my site. Or, at least, that's what is seems. In fact, when Youtube and Bitchute hosted my videos, their figures were not recorded here. Some of these files are very long, and may not be fully downloaded.
To check for consistency, divide the total bandwidth by the length of the original video. 'Lords of the Nukes' is about 1.7GB, and 5.38TB suggesting about 3200 downloads. But some of these downloads are compressed.... Plenty of scope for puzzles, therefore. 
| |
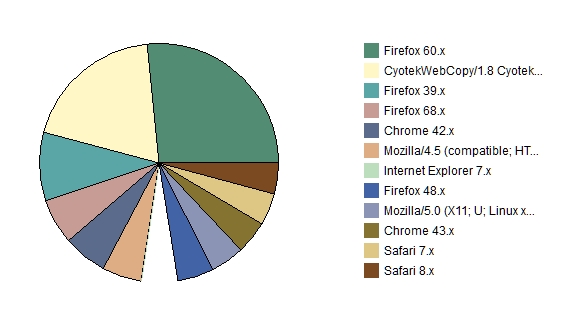
Pie-chart report of the browsers used by people looking at your site (in this case, these are filtered by country. These were only from Japan).
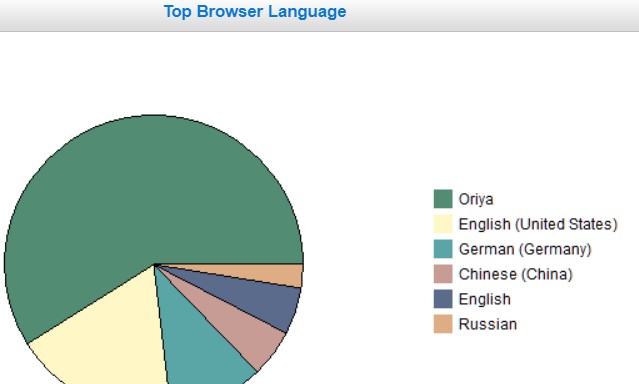
Puzzle of the type which attempted analyses can throw up. Oriya is a language spoken in eastern India and/or Bangla Desh. Are they interested? Are they paid to pretend to look at sites? Of these languages, Oriya had only 23 hits, 0.15% of total hits, the other 5 languages being less. What was happening here?

|
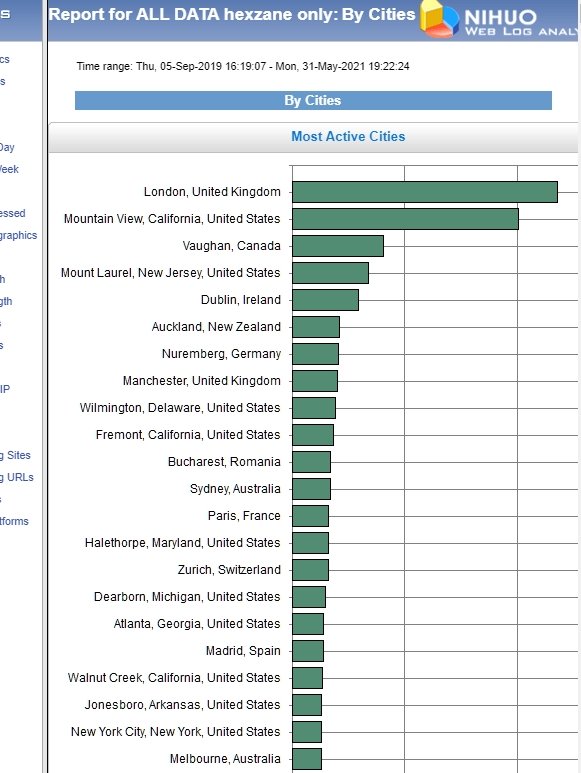
List of Cities, in descending order of files downloaded. The report is taken from I.P. addresses; some will be hidden, wrong, etc. And in this example these filenames all contained hexzane527. Presumably the viewers were looking at the new interpretations of Hitler, Churchill, Stalin, and others. 
| |
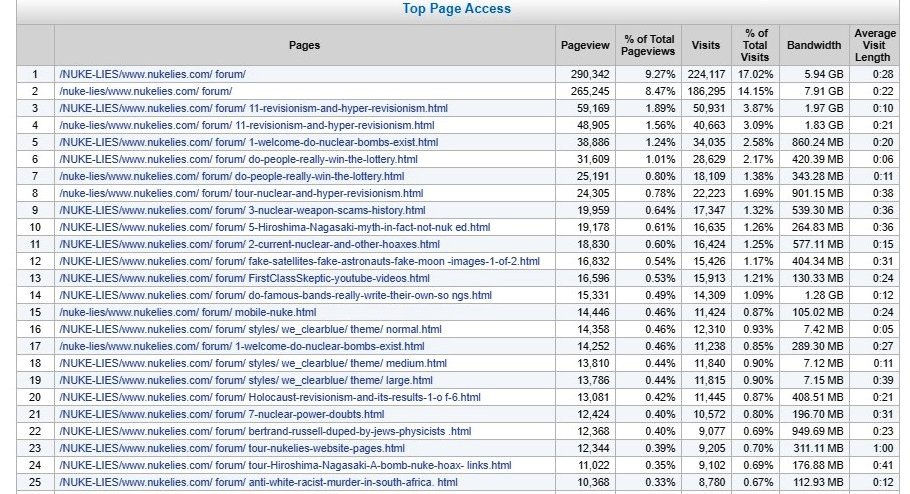
HTML pages, with 'nuke' in the file-name, i.e. all the nuclear-related files in the nuke lies forum on my site.
Note that I changed from NUKE-LIES to the lower-case nuke-lies, which is preferred. The files should be fairly identical. However, sometimes I insert a new comment even though the filename is the same. 
|
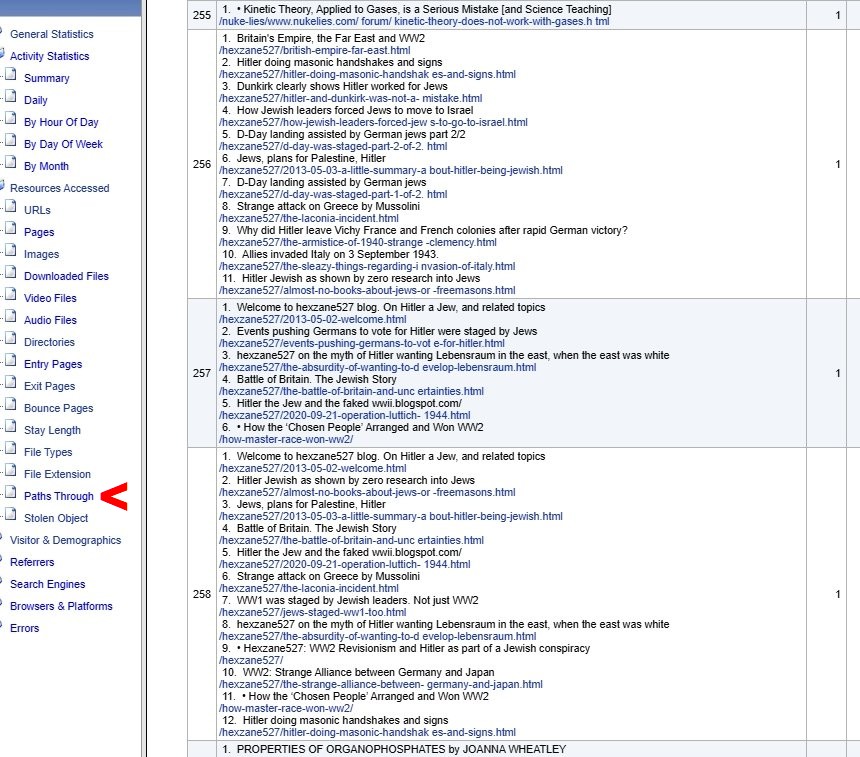
Interesting list of 'Paths through' the site, numbered by popularity.
Here, I've screensaved, from the very long file, the 256th path (with 11 steps). It was used by just one person. To be clearer, I set the 'page titles' on.
Nihuo must look for an I.P. being live, and record the sequence of steps—quite a load.
Paths through can help to check the efficiency of paths; a new link may make a file more accessible, for example. I looked here for freemasons-nasa which seems under-linked. 
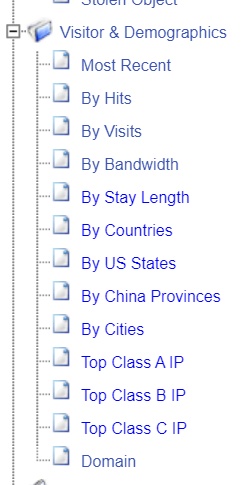
Looking at IP addresses of readers of your site. Sometimes the 'Visitors and Demographics' tab shows up IP Classes: Class A being of the type 123. something, Type B being of type 123.45. something, and Type C being of type 123.45.67
However, I haven't been able to work out when these classes appear; mostly they don't!

| |
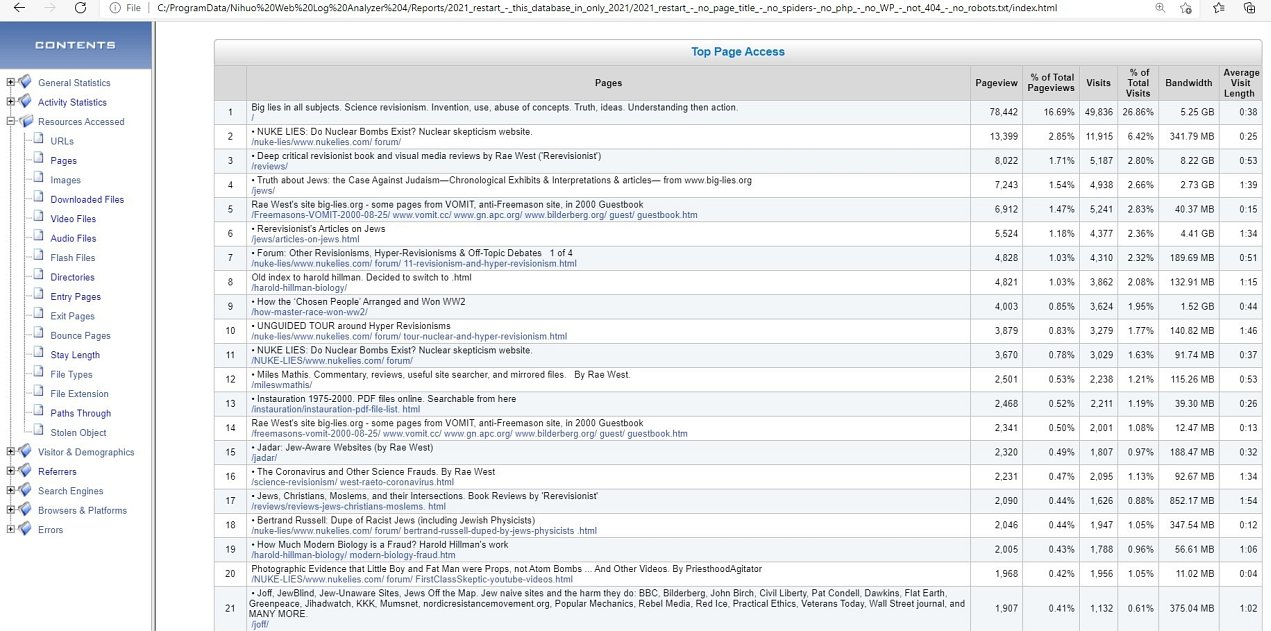
HTML pages. WITH the pages' titles.
Helpful in deciding if titles held in the <head> of the HTML files are helpful, relevant, consistent, missing, formatted properly, spelt correctly, incomplete, etc. 
When Titles of Pages are on, they can be searched. Usually this shows up information otherwise hidden. Obviously, here I'd searched for the name 'Jew'.

|
Something that AWStats can't do.
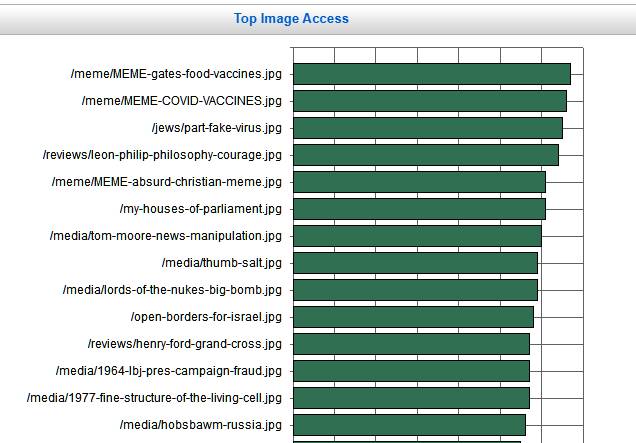
Listed in descending order are images embedded into HTML pages, in the previous 24 hours. I've looked for .jpg and .jpeg files. There are .gif files too, but mostly just national flags. And some .bmp (bitmap) and .png (portable net graphics) which I rarely use.
Useful as a cross-check. Many images only appear in one page, where they're relevant. Helpful reminder. 
|
|
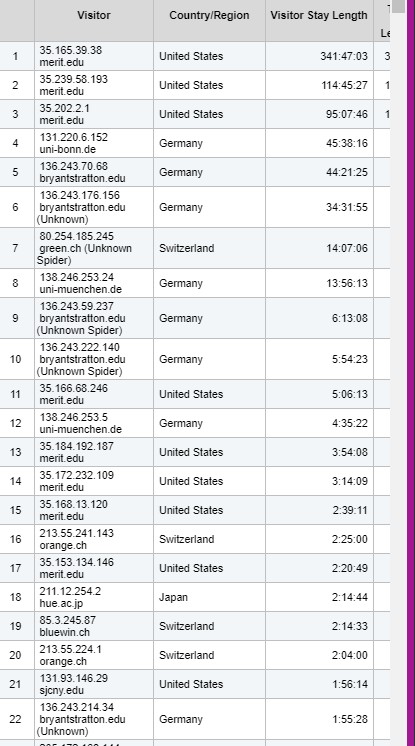
Looking for academic institution queries. Just out of interest.
There are some fairly standard Domain Name constructions. For example ucl.ac.uk is University College, London. Complete with joke stuff on Climate Change, so-called disruptive thinking, and other lies.
I found .ac. .edu .ae. u- uni- and univ- in 'Visitor Domain', though many places, e.g. sorbonne.fr scorn such plebby devices. I can't find any university in Rome, in this way, for example. Conversely, the USA has abundant more or less joke universities, scrambling for Jewish crumbs, such as a 'health university' festooned with 'COVID' rubbish.
hue.ac.jp is Hiroshima University of Economics. merit.edu is some sort of IP connection, based in Illinois; not (I think) the same as universities in Egypt and Pakistan. Many German universities put uni- in their names.

|
|
The 'format' options are separate from the instructions in each report. This must be to allow the reports to be re-run, but with slight differences.
In this case, we're looking at some of the addresses, which include the query symbol. Facebook in particular adds a long string, starting ?fbclid= , onto your HTML address. The long string must include the destination file name, the originating name and details, things like date and time, and other stuff.
A random example is /jadar/?fbclid=IwAR2uGExw5X5cPql3i0kmakeT OREzhvi1xYrocDMoREGcMaVnD6efTVFj_Lw most of which means nothing to me, but I think identifies it to me as being from Facebook.
If Facebook clicks are important to your site, you can estimate how many by looking with the ? parameter counted as part of the address (which means they're treated separately). It may be possible to work out where they're from in Facebook, but I don't know how. If you're only interested in the grand totals for each address, check the box Ignore Parameters in the file names'.

|
|
Both types are shown here, rather confusingly though, from different views. The top screenshot is the one generated when the tickbox option is set to ignore the parameters after the address. In this case, it shows my site had more hits to my review, mensa.html, than to any other single page. However, many of these originated from Facebook, and presumably from different parts of it—though I'm not certain.
And the screenshot below gives just a little of the information on the people reading my mensa.html page.


|
![]() 4.4 Counting Facebook (and other referrers) which load from your site
4.4 Counting Facebook (and other referrers) which load from your site


